Using OSForensics with PassMark Volatility Workbench
Volatility is a well know collection of tools used to extract digital artifacts from volatile memory (RAM). The physical memory dump obtained by OSForensics is compatible with Volatility. PassMark Software has released Volatility Workbench to aid the use of Volatility with OSForensics.
In this tutorial, we are using OSForensics V5 and Volatility Workbench V1.0 to:
- Obtain a memory dump in OSForensics
- Launch Volatility Workbench to:
- Get a list of running processes
- Run several commands
- Transfer the results back to OSForensics
Volatility Workbench is included with the installation of OSForensics starting in V5. If you are using a previous version of OSForensics, you will need to obtain Volatility Workbench here. After you have downloaded Volatility Workbench, extract the files from the zip archive and be utilized later.
Obtaining a Memory Sample
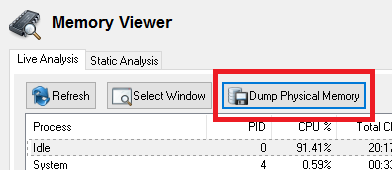
You can obtain a memory dump from within OSForensics Memory Viewer Module. You will need to choose "Dump Physical Memory" button. Save the file and remember the location as we will use this sample in our tutorial. It is recommended if you have available storage on a Solid State Drive (SSD) that it be used as the save destination. Volatility is slow and single threaded, while memory dumps are big. So a fast CPU and SSD can help.
Launching Volatility Workbench
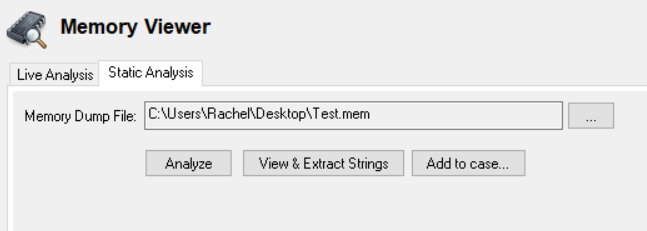
If using OSForensics V5, after obtaining the dump, you can launch Volatility Workbench in the Memory Viewer module under the Static Analysis tab. Select the appropriate memory dump file and choose Analyze.
For previous versions of OSForensics, you can launch Volatility Workbench, but running the VolatilityWorkbench.exe executable from the zipped archive previously extracted. Load the image file and select the correct Profile the memory dump was collected from.
Getting Acquainted with Volatility Workbench (and get a list of running processes)
If Volatility Workbench was loaded from a OSForensics V5 memory dump, an accompanying memory dump configuration file will automatically be created alongside it. The configuration file includes the storage of the operating system profile, KDBG address and process list. When a memory image is re-loaded, this saves a lot of time and avoids the frustration of not knowing the correct profile to select.
If the sample memory dump file does not have an accompanying .CFG file or the dump was obtained elsewhere, you can still use Volatility Workbench. You can get a list of running processes by using the "Get Process List" button.
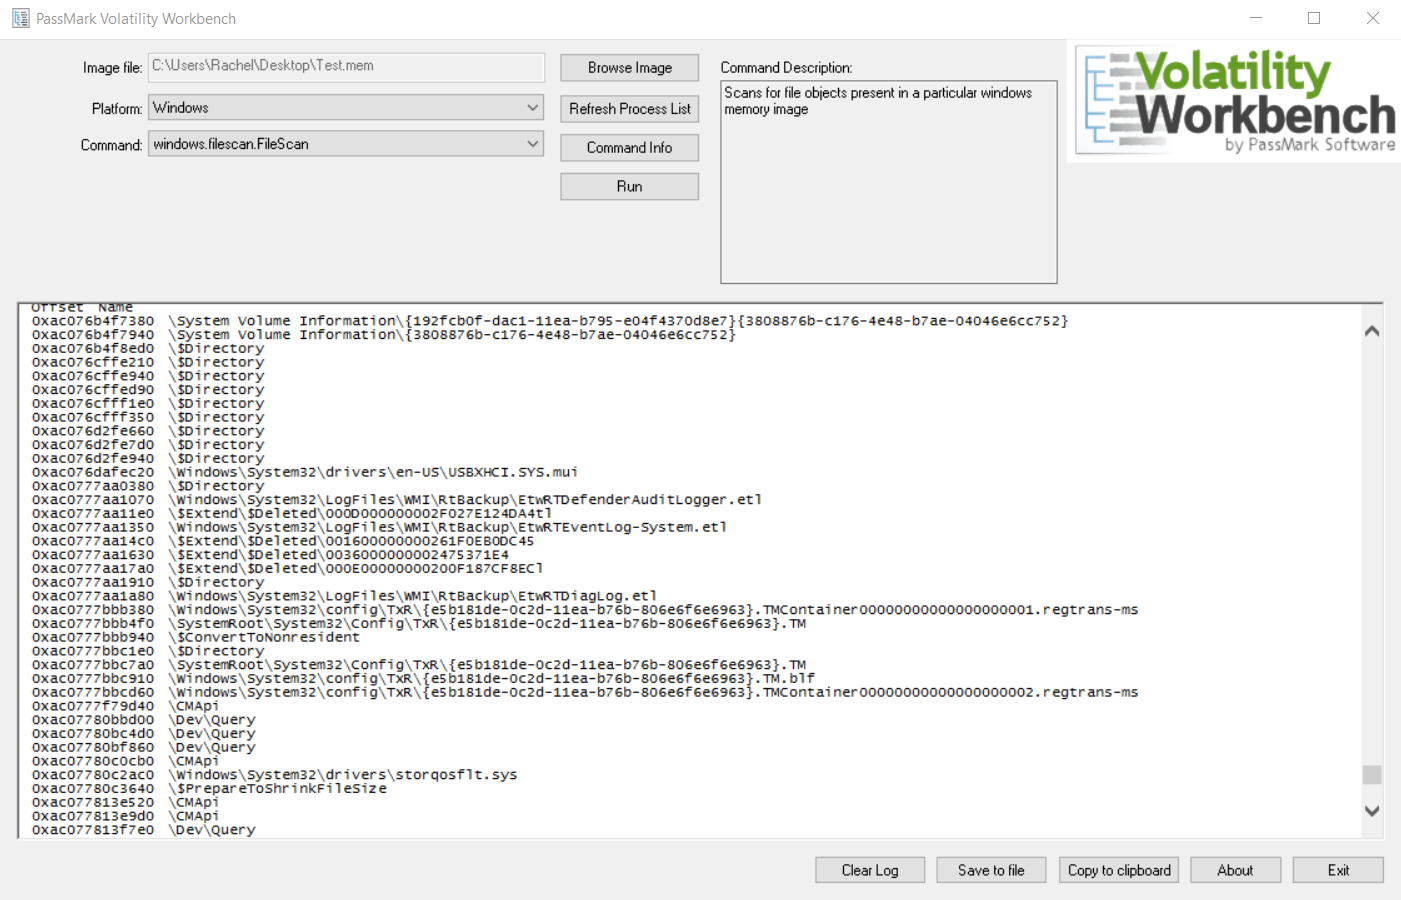
Run several commands
In this example we are going to run several Volatility plug-ins on a memory sample. Suppose we would like to get a list of open handles and detect API hooks for a process. Particularly, we will be using the handles and apihooks commands.
Select the appropriate command from the Command drop down list, handles can be find in the Analyze Process DLLs and Handles section. The Process ID selection will be enabled allowing you to select an appropriate process to run the scan on. Start the scan by clicking the run button.
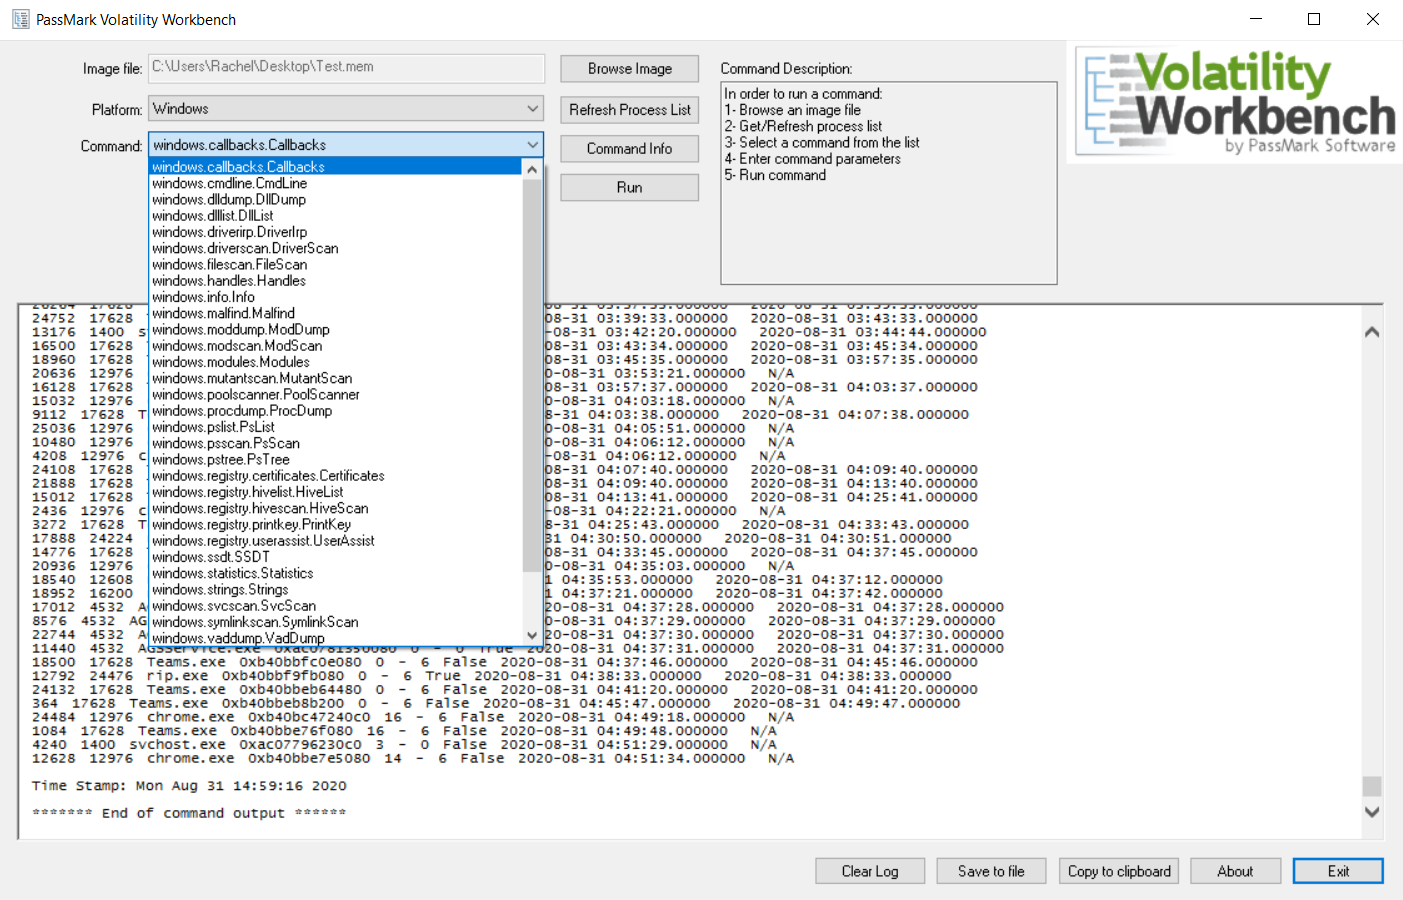
Once the scan is previous scan is finished. We will now look for the apihooks under available commands. Select it and proceed as before. The output from Volatility will be displayed in the log window.
Transfer Results back to OSForensics
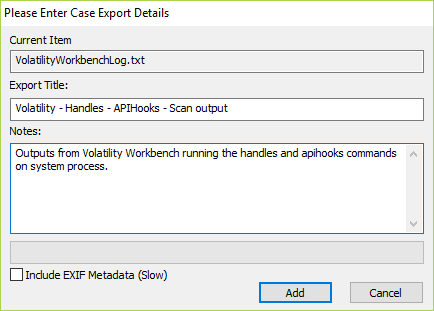
To get the results from the Volatility scan back into OSForensics. You can select the Save to file option in Volatility Workbench. This will save the log output into a file for us to add in OSForensics Add Attachment option in the Manage Case module.